The network for agriculture in Ontario, Canada
Are those Christmas lights in Ontario? Nope it's a map of corn (red) vs soybean (grn) grown in 2013
The 2013 Agriculture Canada (AAFC) crop inventory map for S. Ontario now available.
Southwestern Ontario:
Citation: Annual Space-Based Crop Inventory for Canada, 2013, Earth Observation Service, Science and Technology Branch, Agriculture and Agri-Food Canada. For further details, contact: Andrew.Davidson@agr.gc.ca
Northern Ontario: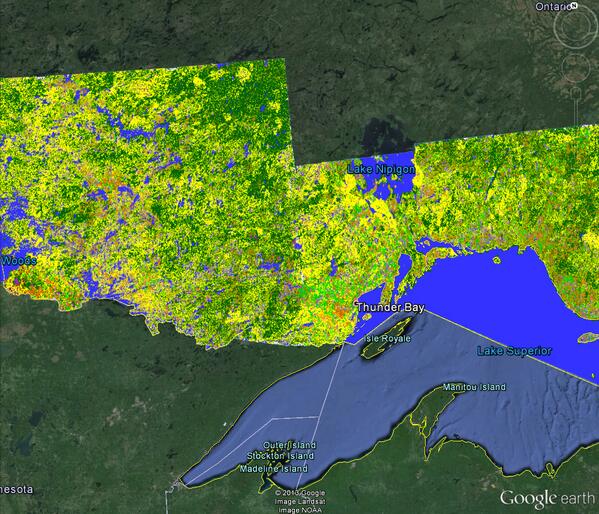

Views: 1994
Comment
-
Comment by OntAG Admin on December 23, 2013 at 6:07am
-
Here is the image that Andrew Davidson mentions....much greater detail.
-
Comment by Andrew Davidson on December 22, 2013 at 3:04pm
-
Hello All: The space-based maps shows here are actually highly accurate (corn = 92%; soybean = 88%). The maps are validated using thousands of ground-based observations collected by our field crews. We are pretty confident that our output maps are of high quality.
So why does the first map not look "right"? It is not actually a problem with the data; rather, it is a by-product of the way that the map-making software renders images at such a broad geographic scale. If you were to zoom into the map to see greater detail, you would see highly detailed maps of field patterns (e.g. http://t.co/NJ7t7LnzZb). But, as you zoom out so that the map covers a greater area, our mapping software sub-samples the map for faster display. As a result, the output becomes overly generalized, and some finer-resolution detail is lost.
To illustrate this, compare the amount of red in the map I link to above to the amount of red in the more generalized map at the top of the page. They look very different, even though they are different "views" of the same map! The difference is due to the map generalization described above.
Feedback on these maps from farmers and producer groups are important to us. However, as I note above, a visual assessment based on the large-area map leads to misleading conclusions because of the rendering issue. But, once we have created versions of these maps that allow zooming -- e.g. in google earth format -- such an assessment would certainly be possible.
If you are interested in further evaluating our data, or for any further questions relating to these maps or what we do, feel free to email me (Andrew.Davidson@agr.gc.ca) or follow me on Twitter (@AndrewMDavidson).
-
-
The images are interesting but the feedback from farmers is that the first one is not accurate.
It must be picking up forests and hay or something else...seems like too much green.
© 2026 Created by Darren Marsland.
Powered by
![]()
You need to be a member of Ontario Agriculture to add comments!
Join Ontario Agriculture